I'm a technical analyst chartist mainly, so everyday after market, I will filter all 800+ stocks counters in sgx and categories them accordingly into the different candle pattern section as described below.
So based on these information, I plan my trades for the next market day.
Due diligence must be taken when planning for your next day trades and therefore the selection of stock is important. Accumulation of small profits everyday will add up and make a difference. Be disciplined and follow your trading rules.
But what matter most is be comfortable of your trading plan. So find a style that suits your character and lifestyle.
Good lucks. If you have any enqueries, feel free to ask me.
dd-mmm-yy Candlestick pattern
1. "Momentum Bullish Trend" stocks list
-----------------------------------------These are the counter with bullish momentum building for past few days..
2. "Maruboza white" stocks list
---------------------------------------criteria: "today total vol > 5dAvg vol by at least 1 times" AND "number of orders transacted >50" AND "price closed at Maruboza white candle"
*Ignored 1 bid below day low

What does Marubozu mean in the market?
In Bullish Marubozu, the open price is the same as the low price and the close price is the same as the high price. Bullish Marubozu means that Bulls are so strong and didn’t let the Bears take the price down when the candlestick became completed. It means there is a lot of buying activity in the market. The longer the candlestick, the stronger the Bulls.
In Bearish Marubozu, the open price is the same as the high price and the close price is the same as the low price. A Bearish Marubozu means that Bears are strong and there is a lot of sell activity in the market specially when the Bearish Marubozu is longer than the previous candlesticks.
What does it mean in general?
1. When you see a Bullish Marubozu, you should not take a short position because the Bulls are strong and the price can go higher.2. When you see a Bullish Marubozu at end of a downtrend, it is a reversal signal. You can just wait for the next candlestick and if it is Bullish too, you can take a long position.
3. If you already have a short position and you see a Bullish Marubozu at the end of the downtrend, you should close your position and take your profit.
Of course we will talk about the candlesticks patterns and you will learn more about taking the right decision when you see different kinds of candlesticks but by now, just keep in mind that Bullish/Bearish Marubozu means the Bulls/Bears are strong.

3. "Gap up Never close Gap" stocks list
-------------------------------------------------A Gap UP occurs when the open of Day 2 is more than the close of Day 1.
There is much psychology behind gaps.
Gaps can act as:
Resistance: Once price gaps downward, the gap can act as long-term or even permanent resistance.
Support: When prices gap upwards, the gap can act as support to prices in the future, either long-term or permanently.
Often after a gap, prices will do what is referred to as "fill the gap". This occurs quite often. Think of a gap as a hole in the price chart that needs to be filled back in. Another common occurance with gaps is that once gaps are filled, the gap tends to reverse direction and continue its way in the direction of the gap (for example, in the chart above of eBay, back upwards).
4. "close day high" stocks list
-------------------------------------criteria: "today total vol > 5dAvg vol by at least 1 times" AND "number of orders transacted >50" AND "price closed Day High or 1 bid below day high" And "Positive"
5. "Long Lower shadow" stocks list
------------------------------------------
If a candlestick has a long lower shadow and short upper shadow, this means that sellers forced the price lower, but for one reason or another, buyers came in and drove prices back up to end the session back near its open price with overwhelming buying interest.
6. "Bullish Engulfing Pattern" stocks list
--------------------------------------------------
The Bullish Engulfing pattern is another candlestick formation which represents a potential reversal in the market when seen in a downtrend. The pattern is made up of a white and black candle where the latest candle (the white candle) opens lower than the previous candle’s (the black candle) close and closes higher than the previous candle’s open. When this happens the current period’s white candle completely engulfs the body previous period’s black candle.
The Bullish Engulfing Pattern represents not indecision in the market, but a situation where the control has shifted from sellers to buyers. The long body of the current candle completely engulfing the body of the previous candle to the upside is representative that the buyers have not only taken control, but have taken control with force. As such, when this pattern is seen during a downtrend in the market it is seen as a potential sign that the trend may be reversing.
7. "Morning Doji Star" stocks list
8. "Morning Doji" stocks list
-------------------------------------8. "Morning Doji" stocks list

The Morning Star Candlestick Pattern is made up of 3 candles normally a long black candle, followed by a short white or black candle, which is then followed by a long white candle. In order to have a valid Morning Start formation most traders will look for a close of the third candle that is at least half way up the body of the first candle in the pattern. When found in a downtrend, this pattern can be a powerful reversal pattern.
What this represents from a supply demand situation is a lot of selling into the downtrend in the period which forms the first black candle, then a period of lower trading but with a reduced range which forms the second period and then a period of trading indicating that indecision in the market, which is then followed by a large up candle representing buyers taking control of the market.
The Morning Star is a 3 candle pattern traders often times will not wait for confirmation from the 4th candle before entering the trade. Like those patterns however traders will look to volume on the third day for confirmation. In addition traders will look to the size of the size of the candles for indication on how big the reversal potential is. The larger the white and black candle and the further that the white candle moves up into the black candle the larger the reversal potential
This pattern can be seen at the bottom of a downtrend. It is known as a strong reversal signal.
1. The first candlestick should be a Bearish candlestick with a considerable body.
2. The second candlestick is a small candlestick that is formed lower than the first one. This candlestick can be Bearish or Bullish. In fact Morning star is the second candlestick but we have to have the first and the second candlesticks for a Morning Star signal.
3. The third candlestick is a Bullish candlestick that is formed higher than the second one and its body covers a significant portion of the first candlestick.
9. "Bullish Harami" stocks list
-----------------------------------------
Harami means pregnant in Japanese. Harami pattern is formed by two candlesticks. One big (the mother) and one small (the baby). The bigger one covers the whole or at least the real body of the smaller one. Harami can be seen both at the top of an uptrend or at the bottom of a downtrend. The small candle can be formed any where along the length of the big candle but the important thing is that it should be covered by the big candlestick.
The more difference between the size of two candlesticks, the more effective and potent the signal is.
Like the Dark Cloud Cover, Piercing Line and Harami can work as reversal signals but they have to be confirmed by the next candlesticks. These patterns can not be known as reliable and strong reversal signals.
If you already have a position and you have some profit in your hands, when you see any of the above patterns, you have to close your trade or at least tighten your stop loss and wait for the market to go ahead.
If it changes the direction, you will be safe because you already collected your profit or your stop loss will protect your profit and if it keeps on moving to the same direction, you will make more profit.
When the small candlestick in Harami pattern is a Doji, the pattern is called Harami Cross. A long body candlestick followed by a Doji which is covered by the long candlestick should not be ignored at all:
10. "Bullish Piercing Line" stocks list
----------------------------------------------A Dark Cloud Cover that happens at the bottom of a downtrend is know is as Piercing Line.

When you see a Dark Cloud Cover at the top of an uptrend or a Piercing Line at the bottom of a downtrend you have to wait for the next candlestick.
If the next candlesticks after a Dark Cloud Cover is a Bullish candlestick that keeps on going up and goes higher than the high price of the second candlestick, then you should consider the Dark Cloud Cover as a continuation signal.
But if the next candlesticks after a Dark Cloud Cover is a Bearish candlestick that goes down and preferably lower than the close price of the second candlestick, then the Dark Cloud Cover you have is a reversal signal.
The same thing is correct about the Piercing Line:
If the next candlesticks after a Piercing Line is a Bearish candlestick that goes down and goes lower than the close price of the second candlestick, then the Piercing Line you have is a continuation signal.
But if the next candlesticks after a Piercing Line is a Bullish candlestick that keeps on going up and preferably goes higher than the high price of the second candlestick in the Piercing Line, then the Piercing Line you have is a reversal signal.
1. "Penny" stocks list
-----------------------------criteria: today total vol > 5dAvg vol by at least 2 times AND number of orders transacted >100 AND price closed positive AND closed price < $1.00
Heavy Breakout Day Volume
Heavy breakout day volume is characterized by a volume spike that towers above the preceding month’s worth of volume (see the figure to the right). Most times you can visually spot what the average volume will look like and compare it to the breakout day volume. Breakout day volume that is above average is heavy volume.
Disclaimer: These are not buy calls, these are just penny stocks that has greater than normal average volume and that has closed green from the volume breakout.. it could be a 1 day event.. watch carefully best.. and i have never see chart for them and also no insider news
12. Consolidation List
-------------------------------------criteria: "today low = yesterday low" AND "netpercent<0" AND "0.5x of 5d avgvol"
13. Bullish Doji (Pending confirmation)
----------------------------------------------criteria: "number of orders transacted >30"

The bullish doji star formation is both extremely rare and extremely reliable. In fact, many candlestick pattern experts consider it the strongest reversal signal seen in a two day pattern. However, many traders nonetheless wait to see what the third day holds. Any moves made on the second day of this pattern should be preparing for a bullish reversal, because it is highly likely. A lot of profit can be made at this point.
Doji means unskillfully.
These kinds of candlesticks are called Doji or unskillfully because they don’t have a body. Why? When the open price and close price are the same we will have a Doji.
So Doji candlesticks have no color and so they are neither Bullish nor Bearish. What does it mean? It means Both Bulls and Bears have the same power and are matched and the price doesn’t know where to go. It doesn’t know if it goes up or down because Bulls are not able to increase the price and Bears are not able to decrease it. So Doji candlesticks are indecision and uncertainty signals.

17. "sell down to day low" stocks list
-----------------------------------
criteria: "today total vol > 5dAvg vol by at least 1 times" AND "number of orders transacted >30" AND "price closed Day Low or 1 bid above day Low"

-------------------------------
This pattern is a very strong reversal signal at the end of a trends. Engulfing pattern is formed by two candlesticks with different colors. The body of the second candlestick should completely engulf the first one. The shadows may also be engulfed but it is not necessary. The first candlestick can also be a Doji.


Engulfing pattern is stronger when the first candlestick has a small and the second candlestick has a big body. Also when the second candlestick engulfs more than one candlestick, the pattern is stronger.

The Evening Star Candlestick Pattern is a mirror image of the Morning Star, and is a reversal pattern when seen as part of an uptrend. The pattern is made up of three candles the first being a long white candle representing buyers driving the prices up, then a short white or black second candle representing indecision in the market, which is followed by a third black candle down which represents sellers taking control of the market.
The close of the third candle needs to be at least half way down the body of the first candle and as with the Morning Star most traders will not wait for confirmation from the 4th period’s candle to consider the pattern valid. Traders will look for increased volume on the third period’s candle for confirmation, the larger the black and white candles are and the further the black candle moves down the body of the white candle the more powerful

22. "Bearish Harami" stocks list-------------------------------

14. "Momentum Bearish Trend" stocks list
---------------------------------------------
15. "Maruboza black" stocks list
------------------------------------------------
criteria: "today total vol > 5dAvg vol by at least 1 times" AND "number of orders transacted >50" AND "price closed at Maruboza black candle"
*Ignored 1 bid above day high

What does Bearish Marubozu mean in the market?In Bearish Marubozu, the open price is the same as the high price and the close price is the same as the low price. A Bearish Marubozu means that Bears are strong and there is a lot of sell activity in the market specially when the Bearish Marubozu is longer than the previous candlesticks.
16.. "Gap Down, never close gap" stocks list
------------------------------------------------------------------------------
criteria: "today total vol > 5dAvg vol by at least 1 times" AND "number of orders transacted >50" AND "price closed at Maruboza black candle"
*Ignored 1 bid above day high
What does Bearish Marubozu mean in the market?
What does it mean in general?
1. When you see a Bearish Marubozu, you should not take a long position.
2. When you see a Bearish Marubozu at end of an uptrend, it is a reversal signal. You can just wait for the next candlestick and if it is Bearish too, you can take a short position.
3. If you already have a long position and you see a Bearish Marubozu at the end of the uptrend, you should close your position and take your profit.
3. If you already have a long position and you see a Bearish Marubozu at the end of the uptrend, you should close your position and take your profit.
Of course we will talk about the candlesticks patterns and you will learn more about taking the right decision when you see different kinds of candlesticks but by now, just keep in mind that Bullish/Bearish Marubozu means the Bulls/Bears are strong.
A Gap Down occurs when the open of Day 2 is less than the close of Day 1.
There is much psychology behind gaps.
Gaps can act as:
Resistance: Once price gaps downward, the gap can act as long-term or even permanent resistance.
Support: When prices gap upwards, the gap can act as support to prices in the future, either long-term or permanently.
Often after a gap, prices will do what is referred to as "fill the gap". This occurs quite often. Think of a gap as a hole in the price chart that needs to be filled back in. Another common occurance with gaps is that once gaps are filled, the gap tends to reverse direction and continue its way in the direction of the gap (for example, in the chart above of eBay, back upwards).
17. "sell down to day low" stocks list
-----------------------------------
criteria: "today total vol > 5dAvg vol by at least 1 times" AND "number of orders transacted >30" AND "price closed Day Low or 1 bid above day Low"
18 "Long upper shadow" stocks list
------------------------------- If a candlestick has a long upper shadow and short lower shadow, this means that buyers flexed their muscles and bid prices higher, but for one reason or another, sellers came in and drove prices back down to end the session back near its open price.
19. "Bearish Engulfing Pattern" stocks listThis pattern is a very strong reversal signal at the end of a trends. Engulfing pattern is formed by two candlesticks with different colors. The body of the second candlestick should completely engulf the first one. The shadows may also be engulfed but it is not necessary. The first candlestick can also be a Doji.


Engulfing pattern is stronger when the first candlestick has a small and the second candlestick has a big body. Also when the second candlestick engulfs more than one candlestick, the pattern is stronger.
20. "Evening Doji Star" stocks list
21. "Evening Doji" stocks list
----------------------------

The Evening Star Candlestick Pattern is a mirror image of the Morning Star, and is a reversal pattern when seen as part of an uptrend. The pattern is made up of three candles the first being a long white candle representing buyers driving the prices up, then a short white or black second candle representing indecision in the market, which is followed by a third black candle down which represents sellers taking control of the market.
The close of the third candle needs to be at least half way down the body of the first candle and as with the Morning Star most traders will not wait for confirmation from the 4th period’s candle to consider the pattern valid. Traders will look for increased volume on the third period’s candle for confirmation, the larger the black and white candles are and the further the black candle moves down the body of the white candle the more powerful
The effectiveness and potency of the Morning Star and Evening Start patterns as reversal signals is dependent on some special factors that you have to considered:
1. The distance (gap) between the morning or evening star with the first and third candlesticks. The bigger gap, the stronger signal.
2. The degree of the coverage of the first candlestick by the third one. The bigger coverage, the stronger signal.
3. The bigger trading volume in the third candlestick than the first one.
2. The degree of the coverage of the first candlestick by the third one. The bigger coverage, the stronger signal.
3. The bigger trading volume in the third candlestick than the first one.
Sometimes the Morning or Evening Star is a Doji candlesticks. Again in this case, the most important thing is the gap between the first and third candlestick and the Doji.


Harami means pregnant in Japanese. Harami pattern is formed by two candlesticks. One big (the mother) and one small (the baby). The bigger one covers the whole or at least the real body of the smaller one. Harami can be seen both at the top of an uptrend or at the bottom of a downtrend. The small candle can be formed any where along the length of the big candle but the important thing is that it should be covered by the big candlestick.
The more difference between the size of two candlesticks, the more effective and potent the signal is.
Like the Dark Cloud Cover, Piercing Line and Harami can work as reversal signals but they have to be confirmed by the next candlesticks. These patterns can not be known as reliable and strong reversal signals.
If you already have a position and you have some profit in your hands, when you see any of the above patterns, you have to close your trade or at least tighten your stop loss and wait for the market to go ahead.
If it changes the direction, you will be safe because you already collected your profit or your stop loss will protect your profit and if it keeps on moving to the same direction, you will make more profit.
When the small candlestick in Harami pattern is a Doji, the pattern is called Harami Cross. A long body candlestick followed by a Doji which is covered by the long candlestick should not be ignored at all:

It is a Bearish reversal signal that can be formed at the top of an uptrend by two candlesticks. The first one is Bullish and the second one is Bearish. Dark Cloud Cover is formed when the second candlestick is started above the high price of the first candlestick but goes down and becomes finished above the open price of the first candlestick.
2. Both candlesticks are shaven (they have no shadow) and the bearish candlestick is opened at the close of the bullish candlestick and also is closed at the close of the bullish candlestick.
3. When the bearish candlestick is opened above a strong resistance and then goes down.
23. "Bearish Dark Cloud Cover" stocks list
--------------------------------------------------------------

It is a Bearish reversal signal that can be formed at the top of an uptrend by two candlesticks. The first one is Bullish and the second one is Bearish. Dark Cloud Cover is formed when the second candlestick is started above the high price of the first candlestick but goes down and becomes finished above the open price of the first candlestick.
Dark Cloud Cover can be considered as a stronger reversal signal when:
1. The closing price of the bearish candlestick is close to the opening price of the previous candlestick.2. Both candlesticks are shaven (they have no shadow) and the bearish candlestick is opened at the close of the bullish candlestick and also is closed at the close of the bullish candlestick.
3. When the bearish candlestick is opened above a strong resistance and then goes down.
All kinds of Doji candlesticks need confirmation.

What should you do when you see a Doji?
As I said, Doji means indecision and uncertainty. When it is seen at the top of an uptrend or at the bottom of a downtrend, it means the price is uncertain to go up or down or sideways. When you see a Doji, if you already have a position, you have to take your profit and if you don’t have any position, you have to wait for the confirmation to choose a direction and enter to a trade.
What do I mean by confirmation? The next candle sticks can work as a confirmation. For example when you see a Gravestone at the top of an uptrend, you should get ready to go short but first you have to wait for the next candlestick or even next two candlesticks. If they are Bearish, it means the price has changed the direction and you can go short.
23 Bearish Doji (Pending confirmation)
-----------------------------------------------------------------------

The bearish doji star is an indicator of change, but only a moderate indicator. Therefore, your next move should be to wait and see, but definitely prepare a plan of action should confirmation of the downturn present itself. While a reversal seems possible and even likely, only time will tell what the future holds. The outcome of the third day should give you a better idea of how to proceed.
24. "Long Legged Doji" stocks list------------------------------
criteria: "number of orders transacted >30"
Please note that Doji candlesticks that have longer shadows, are stronger.

25. "Gravestone doji" stocks list
26. "Dragonfly doji" stocks list
--------------------------------------------
criteria: "number of orders transacted >30"

This Gravestone Doji also means indecision and when it is seen at the top of an uptrend it means the prices wants to bounce down. At the bottom of the market sometimes you see the Inverted Gravestone:
Inverted Gravestone is also known as Dragonfly.
Of course it doesn’t mean that inverted gravestone or gravestone can not be seen at the top or bottom of the market. In both cases they signal indecision.
27. "Hammer" stocks list---------------------------------
criteria: "number of orders transacted >30"

Like the Spinning Top and Doji where we learn to trade chart patterns, the Hammer candlestick pattern is made up of one candle. The candle looks like a hammer as it has a long lower wick and a short body at the top of the candlestick with little or no upper wick. In order for a candle to be a valid hammer most traders say the lower wick must be two times greater than the size of the body potion of the candle, and the body of the candle must be at the upper end of the trading range.
When you see the Hammer form in a downtrend this is a sign of a potential reversal in the market as the long lower wick represents a period of trading where the sellers were initially in control but the buyers were able to reverse that control and drive prices back up to close near the high for the day, thus the short body at the top of the candle.
After seeing this chart pattern form in the market most traders will wait for the next period to open higher than the close of the previous period to confirm that the buyers are actually in control.
Two additional things that traders will look for to place more significance on the pattern are a long lower wick and an increase in volume for the time period that formed the hammer.
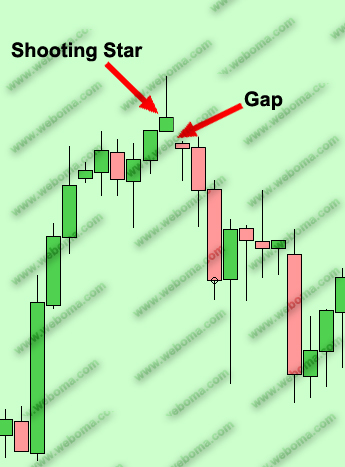
28."Shooting Star" stocks list
------------------------------------------
criteria: "number of orders transacted >30"

It is an inverted hammer at the top of the uptrend. Its color can be Bullish or Bearish. A Shooting Star at the bottom of a downtrend, is called Inverted Hammer. Like Doji and Hammer, Shooting Star and inverted Hammer need confirmation.
A gap between the Shooting Start or Inverted Hammer and the next candlestick is one of the confirmations. A big Bearish candlestick after the Shooting Start is another confirmation. Generally, confirmation is something that confirms that the price has changed the direction.
29. "Hanging man" stocks list
------------------------------------------
criteria: "number of orders transacted >30"

The Hanging Man is basically the same thing as Hammer formation but instead of being found in a downtrend it is found in an uptrend. Like the Hammer pattern, the Hanging man has a small body near the top of the trading range, little or no upper wick, and a lower wick that is at least two times as big as the body of the candle.
Unlike the Hammer however the selling pressure that forms the lower wick in the Hanging Man is seen as a potential sign of more selling pressure to come, even though the candle closed in the upper end of its range. While the lower wick of the Hammer represents selling pressure as well, this is to be expected in a downtrend. When seen in an uptrend however selling pressure is a warning sign of potential more selling pressure to come and thus the categorization of the Hanging Man as a bearish reversal pattern.
As with the Hammer and as with most one candle chart patterns most traders will wait for confirmation that selling pressure has in fact taken hold by watching for a lower open on the next candle. Traders will also place additional significance on the pattern when there is an increase in volume during the period the Hanging Man forms as well as when there is a longer wick.
Hammer is kind of candlestick that can be seen at the bottom of a downtrend. Hammer has no or a very small upper shadow. The hammer candlestick which is seen at the top of an uptrend is called Hanging Man.
Hammer and Hanging Man have three identifying features:
1. The body is in the upper third of the price range.2. The lower shadow is twice of the length of the body.
3. They have no or a very short upper shadow.
Like Doji, Hammer and Hanging man signal indecision and uncertainty and need confirmation.

30. "Inverted Hammer" stocks list
---------------------------------------------
criteria: "number of orders transacted >30"

As its name implies, the inverted Hammer looks like an upside down version of the Hammer Candlestick Chart Pattern which we learned about several lessons ago. Like the Hammer Pattern, the Inverted Hammer is comprised of one candle and when found in a downtrend is considered a potential reversal pattern.
The pattern is made up of a candle with a small lower body and a long upper wick which is at least two times as large as the short lower body. The body of the candle should be at the low end of the trading range and there should be little or no lower wick in the candle.
What this chart pattern is basically telling us is that although sellers ended up driving price down to close near to where it opened, buyers had significant control of the market at some point during the period which formed the long upper wick. This buying pressure during the downtrend calls the trend into question which is why the candle is considered a potential reversal pattern. Like the other one candle patterns we have learned about however, most traders will wait for a higher open on the next trading period before taking any action based on the pattern.
Most traders will also look at a longer wick as a sign of a greater potential reversal and like to see an increase in volume on the day the Inverted Hammer Forms.
31. "Spinning top" stocks list
---------------------------------------
criteria: "today total vol > 5dAvg vol by at least 1 times" AND "number of orders transacted >30" AND "price closed at doji star"

When a candlestick with a short body in the middle of two long wicks forms in the market this is indicative of a situation where neither the buyers nor the sellers have won for that time period as the market has closed relatively unchanged from where it opened. The upper and lower long wicks however tell us that both the buyers and the sellers had the upper hand at some point during the time period the candle represents. When you see this type of candlestick form after a runup or run down in the market it can be an indication of a pending reversal as the indescision in the market is representative of the buyers loosing momentum when this occurs after an uptrend and the sellers loosing momentum after a downtrend.
Disclaimer:These are not buy calls, these are just the last candle stick formed.
Certain guidelines should be established:
1) Most patterns require confirmation.
Certain guidelines should be established:
1) Most patterns require confirmation.
2) Reversal patterns should form within a opposite trend.
3) Other aspects of technical analysis should be used as well.